พลวัตของสปินและประจุในโมเดล Fermi-Hubbard
ประมาณการการใช้งาน: 5 นาทีบนตัวประมวลผล Heron r3 (หมายเหตุ: เป็นเพียงการประมาณ เวลารันจริงของคุณอาจต่างออกไป)
ความเป็นมา
โมเดล Fermi-Hubbard อธิบายอิเล็กตรอนที่กระโดดบนแลตทิซ โดยมีบทลงโทษด้านพลังงานเมื่อมีอิเล็กตรอนสองตัวอยู่ที่ไซต์เดียวกัน บนสายโซ่หนึ่งมิติที่มี ไซต์และขอบเปิด Hamiltonian ถูกกำหนดดังนี้
โดยที่ สร้างเฟอร์มิออนที่มีสปิน บนไซต์ และ นับจำนวนของมัน สามพจน์คือแอมพลิจูดการกระโดด บนพันธะระหว่างไซต์ และ อันตรกิริยาบนไซต์ และศักย์เคมี บทเรียนนี้วัดพลังงานในหน่วย และเวลาในหน่วย
พลวัตเรียลไทม์ของโมเดลนี้คำนวณด้วยวิธีคลาสสิกได้ยาก Exact diagonalization หยุดอยู่ราว ไซต์ และหลัง quench เอนโทรปีของ entanglement ของ tensor-network solver จะโตเชิงเส้นตามเวลา ทำให้ bond dimension ที่ต้องใช้เพื่อความแม่นยำคงที่โตแบบเอกซ์โพเนนเชียล
ในหนึ่งมิติ การกระตุ้นพื้นฐานคือ spinon ซึ่งมีสปินแต่ไม่มีประจุ และ holon ซึ่งมีประจุแต่ไม่มีสปิน ทั้งสองแพร่ด้วยความเร็วต่างกัน ดังนั้นการรบกวนเฉพาะที่จึงแยกเป็น front เร็วและ front ช้า ปรากฏการณ์นี้เรียกว่า spin-charge separation และบทเรียนนี้วัดมัน [1]
บทเรียนนี้ใช้ Dynamics Simulator Qiskit Function ซึ่งรับ Hamiltonian สถานะเริ่มต้น ตาราง Trotter และรายการ observable แล้วส่งคืนค่าคาดหมาย มันจัดการ Jordan-Wigner mapping, Trotterization, ผัง qubit และการกดทอน error ภายในเอง จึงไม่มี circuit ให้สร้างหรือ transpile ในบทเรียนนี้
สิ่งที่ต้องมี
ก่อนเริ่มบทเรียนนี้ ตรวจสอบให้แน่ใจว่าคุณติดตั้งแพ็กเกจต่อไปนี้แล้ว
-
Qiskit SDK v2.3.0 ขึ้นไป (
pip install qiskit) -
Qiskit Runtime v0.50.0 ขึ้นไป (
pip install qiskit-ibm-runtime) -
Qiskit Functions Catalog v0.21.0 ขึ้นไป (
pip install qiskit-ibm-catalog) -
NumPy v2.5.1 ขึ้นไป (
pip install numpy) -
Matplotlib v3.10.3 ขึ้นไป (
pip install matplotlib) -
Q-CTRL Visualizer v11.0.0 ขึ้นไป (
pip install qctrl-visualizer)
การตั้งค่า
ก่อนอื่น ยืนยันตัวตนด้วย IBM Quantum API key ของคุณ จากนั้นเลือก Qiskit Function ดังนี้ (โค้ดนี้สมมติว่าคุณบันทึกบัญชีของคุณไว้ในสภาพแวดล้อมในเครื่องแล้ว)
# Added by doQumentation — installs the packages this notebook needs if they are missing
import importlib.util

_needed = {"matplotlib": "matplotlib", "numpy": "numpy", "qctrlvisualizer": "qctrlvisualizer", "qiskit_ibm_catalog": "qiskit-ibm-catalog", "qiskit_ibm_runtime": "qiskit-ibm-runtime", "scipy": "scipy"}
_missing = [pip for module, pip in _needed.items()
            if importlib.util.find_spec(module) is None]
# One at a time, so a package that fails to install does not block the others
for _pip in _missing:
    %pip install -q {_pip}
if not _missing:
    print("\u2713 All required packages are installed")
import numpy as np
import matplotlib.pyplot as plt
from scipy import stats
from qiskit_ibm_catalog import QiskitFunctionsCatalog
from qiskit_ibm_runtime import QiskitRuntimeService
import qctrlvisualizer as qv

plt.style.use(qv.get_qctrl_style())
catalog = QiskitFunctionsCatalog(channel="ibm_quantum_platform")

# Access Function
sim_qf = catalog.load("q-ctrl/dynamics-simulator")
ขั้นตอนที่ 1: แมปอินพุตคลาสสิกไปเป็นปัญหาควอนตัม
กำหนด Hamiltonian
ฟังก์ชันรับโมเดลเป็น dictionary ที่มีสามคีย์ แต่ละคีย์รับได้ทั้ง float ค่าเดียวซึ่งใช้เท่ากันตลอดสายโซ่ หรือลิสต์ที่ระบุค่าทีละไซต์ ลิสต์มี รายการสำหรับ hopping_amplitude เพราะสายโซ่เปิดมีพันธะน้อยกว่าไซต์หนึ่งพันธะ และมี รายการสำหรับ on_site_interaction และ chemical_potential
บทเรียนนี้ใช้สายโซ่สม่ำเสมอ 31 ไซต์ที่มีอันตรกิริยาแบบผลัก ศักย์เคมีที่สม่ำเสมอให้เพียงเฟสรวมเมื่อจำนวนอนุภาคคงที่ ตัวอย่างนี้จึงตั้งเป็นศูนย์ ศักย์เคมีมีความสำคัญเมื่อมันเปลี่ยนไปตามไซต์เท่านั้น เช่น เพื่อเพิ่ม disorder หรือสิ่งเจือปนเดี่ยว
site_count = 31
hopping_amplitude = 1.0
on_site_interaction = 8.0
chemical_potential = 0.0

model = {
    "hopping_amplitude": [hopping_amplitude] * (site_count - 1),
    "on_site_interaction": [on_site_interaction] * site_count,
    "chemical_potential": [chemical_potential] * site_count,
}

print(
    f"{site_count} sites, {2 * site_count} qubits, U/t_h = {on_site_interaction:.0f}"
)
31 sites, 62 qubits, U/t_h = 8
ตั้งค่าตาราง Trotter
dictionary simulation เก็บขนาดก้าวเวลา () และจำนวนก้าว Trotter โดยเวลาวิวัฒนาการรวมคือผลคูณของทั้งสอง ก้าวที่ใหญ่กว่าไปถึงเวลาที่ไกลกว่าที่ความลึก circuit คงที่ แต่เกิด Trotter error มากขึ้น ซึ่งโตตาม เพราะพจน์ของ Hamiltonian สลับที่กันได้น้อยลง การศึกษาบนฮาร์ดแวร์ที่ตีพิมพ์ใช้ สำหรับ [2] และบทเรียนนี้ใช้ค่าเดียวกัน ความลึก circuit โตเชิงเส้นตามจำนวนก้าวและไม่ขึ้นกับ เลย
time_step = 0.15
step_count = 30

simulation = {"time_step": time_step, "step_count": step_count}

print(
    f"Total evolution time: t = {time_step * step_count:.2f} (units of 1/t_h)"
)
Total evolution time: t = 4.50 (units of 1/t_h)
เตรียมสถานะเริ่มต้น
แต่ละไซต์มีสปินออร์บิทัลสองตัว ดังนั้นสายโซ่ ไซต์ใช้ qubit สถานะเริ่มต้นเป็นสตริงการครอบครองแบบ Fock ที่มีหนึ่งตัวอักษรต่อไซต์
สตริงถูกอ่านโดยเริ่มจากไซต์ที่มีนัยสำคัญน้อยที่สุด ดังนั้นตัวอักษรขวาสุดคือไซต์ 0 และดัชนีไซต์จริงของตัวอักษรที่ นับจากซ้ายคือ สตริง udud จึงหมายความว่าไซต์ 0 คือ d, ไซต์ 1 คือ u, ไซต์ 2 คือ d และไซต์ 3 คือ u
ถัดไป เตรียมสถานะ Néel แบบเติมครึ่ง สลับ u และ d โดยแทนไซต์กลางด้วยที่ว่าง ที่ว่างนี้คือการรบกวนที่เราติดตามการแผ่ขยายของมัน
vacancy_site = site_count // 2

# Build in increasing site order, then reverse: the leftmost character of the
# string is the highest site index.
site_occupations = [
    "u" if site % 2 == 0 else "d" for site in range(site_count)
]
site_occupations[vacancy_site] = "e"
initial_state = "".join(reversed(site_occupations))

print(f"Vacancy at site {vacancy_site}")
print(initial_state)
Vacancy at site 15
udududududududueudududududududu
สร้าง observable
observable แต่ละตัวเป็น dictionary ที่แทนผลรวมถ่วงน้ำหนักของผลคูณของตัวดำเนินการการครอบครอง
ทุกรายการของ operators คือหนึ่งพจน์ เขียนเป็นลิสต์ของคู่ [name, site] ที่คูณกัน และรายการที่ตรงกันของ coefficients คือน้ำหนักของมัน ชื่อทั้งสองคือ "Nup" สำหรับ และ "Ndn" สำหรับ observable จุดเดียวหนึ่งตัว เขียนได้ดังนี้
{"operators": [[["Nup", 3]]], "coefficients": [1.0]}
เซลล์ถัดไปพิมพ์ชุดอินพุตที่สมบูรณ์เล็กที่สุดที่ฟังก์ชันรับได้ ซึ่งมีประโยชน์เป็นแบบอ้างอิงรูปร่างขณะอ่านโค้ดต่อจากนี้
minimal_inputs = {
    "model": {
        "hopping_amplitude": 1.0,
        "on_site_interaction": [2.0, 2.5],
        "chemical_potential": 0.5,
    },
    "simulation": {"step_count": 5, "time_step": 0.1},
    "observables": [{"operators": [[["Nup", 0]]], "coefficients": [1.0]}],
    "initial_state": "ud",
    "shots": 4096,
}

for key, value in minimal_inputs.items():
    print(f"{key}: {value}")
model: {'hopping_amplitude': 1.0, 'on_site_interaction': [2.0, 2.5], 'chemical_potential': 0.5}
simulation: {'step_count': 5, 'time_step': 0.1}
observables: [{'operators': [[['Nup', 0]]], 'coefficients': [1.0]}]
initial_state: ud
shots: 4096
ต้องใช้ observable สามกลุ่ม ความหนาแน่นประจุ และสปินเฉพาะที่ ต่างเป็นผลรวมสองพจน์บนตัวดำเนินการชุดเดียวกัน ต่างกันที่สัมประสิทธิ์เท่านั้น ตัวสัมพันธ์สปิน ระหว่างไซต์ และไซต์ที่ว่างขยายเป็นพจน์สองจุดสี่พจน์ที่มีสัมประสิทธิ์
ตัวดำเนินการการครอบครองสลับที่กันได้ ดังนั้นลำดับของตัวประกอบภายในพจน์ไม่มีผล แต่ลำดับของลิสต์ observables กำหนดลำดับของค่าที่ส่งคืน โค้ดบันทึกดัชนีของแต่ละกลุ่มขณะสร้างลิสต์ ตัวสัมพันธ์ข้ามไซต์ที่ว่างไป เพราะตรงนั้นผลคูณจะซ้ำตัวประกอบ
observables = []
charge_indices = []
spin_indices = []
correlator_indices = []

# Charge density: n_i = n_{i,up} + n_{i,down}
for site in range(site_count):
    charge_indices.append(len(observables))
    observables.append(
        {
            "operators": [[["Nup", site]], [["Ndn", site]]],
            "coefficients": [1.0, 1.0],
        }
    )

# Local spin: S^z_i = (n_{i,up} - n_{i,down}) / 2
for site in range(site_count):
    spin_indices.append(len(observables))
    observables.append(
        {
            "operators": [[["Nup", site]], [["Ndn", site]]],
            "coefficients": [0.5, -0.5],
        }
    )

# Spin correlator: S^z_i S^z_{i_*}, expanded into four two-point terms.
correlator_sites = [
    site for site in range(site_count) if site != vacancy_site
]
for site in correlator_sites:
    correlator_indices.append(len(observables))
    observables.append(
        {
            "operators": [
                [["Nup", site], ["Nup", vacancy_site]],
                [["Nup", site], ["Ndn", vacancy_site]],
                [["Ndn", site], ["Nup", vacancy_site]],
                [["Ndn", site], ["Ndn", vacancy_site]],
            ],
            "coefficients": [0.25, -0.25, -0.25, 0.25],
        }
    )

print(f"{len(observables)} observables")
print("Example correlator:", observables[correlator_indices[0]])
92 observables
Example correlator: {'operators': [[['Nup', 0], ['Nup', 15]], [['Nup', 0], ['Ndn', 15]], [['Ndn', 0], ['Nup', 15]], [['Ndn', 0], ['Ndn', 15]]], 'coefficients': [0.25, -0.25, -0.25, 0.25]}
ขั้นตอนที่ 2: ปรับปัญหาให้เหมาะกับการรันบนฮาร์ดแวร์ควอนตัม
บทเรียนนี้ไม่มีขั้นตอน transpilation ฟังก์ชันทำขั้นตอนต่อไปนี้ภายใน [2] และคุณกำหนดค่าจาก notebook ไม่ได้
-
แมปโหมดเฟอร์มิออนไปยัง qubit ตามลำดับที่เลือกเพื่อให้น้ำหนัก Pauli ต่ำบนแลตทิซ heavy-hex
-
ใช้ fermionic SWAP network เพื่อให้ทุกพจน์การกระโดดกลายเป็นการหมุนสอง qubit
-
ฝังสายโซ่ไปตามเส้นทางที่หลีกเลี่ยง qubit ที่อ่อน
-
ใช้ dynamical decoupling และ Pauli twirling ระหว่างการคอมไพล์
คุณเลือก backend และจำนวน shot ฟังก์ชันรับชื่อ backend เป็นสตริง บทเรียนนี้จึงเลือกอุปกรณ์ที่ว่างที่สุดซึ่งใหญ่พอสำหรับสายโซ่ แล้วส่งชื่อของมัน
สัญญาณที่เล็กที่สุดที่คุณต้องแยกแยะเป็นตัวกำหนดจำนวน shot ตัวติดตามประจุได้แอมพลิจูดใกล้ แต่ตัวติดตามสปินแบบ connected มีค่าสูงสุดราว เล็กกว่าประมาณสี่เท่า การศึกษาที่ตีพิมพ์จึงใช้ 20,000 shot ต่อ circuit [2]
service = QiskitRuntimeService()
backend = service.backend("ibm_boston")
backend_name = backend.name
shot_count = 20_000

print(f"{backend_name}, {shot_count} shots per circuit")
ibm_boston, 20000 shots per circuit
ขั้นตอนที่ 3: รันโดยใช้ Qiskit primitives
ถัดไป ส่งการจำลอง run ส่งคืน job handle ทันทีโดยไม่บล็อก
job = sim_qf.run(
    model=model,
    simulation=simulation,
    observables=observables,
    initial_state=initial_state,
    shots=shot_count,
    backend_name=backend_name,
)
print(job.job_id, job.status())
6261b073-be19-48a1-be60-2f369b25613c QUEUED
ใช้ job.status() เพื่อติดตามความคืบหน้า และ job.result() เพื่อบล็อกจนกว่างานจะเสร็จ ผลลัพธ์เป็น mapping ที่รายการ observable_expectation_values ถูกทำดัชนีก่อนด้วย observable ตามลำดับที่ส่งเข้าไป แล้วจึงด้วยเวลา มี step_count + 1 จุดเวลา เพราะรวมค่าที่ ด้วย
result = job.result()

print("Result keys:", sorted(result.keys()))
Result keys: ['observable_expectation_values', 'observables', 'provider_job_ids', 'warnings']
ขั้นตอนที่ 4: ประมวลผลหลังการรันและส่งคืนผลลัพธ์ในรูปแบบคลาสสิกที่ต้องการ
สร้างตัวสัมพันธ์ขึ้นใหม่
แยก array แบบแบนกลับเป็นสามกลุ่มโดยใช้ดัชนีที่บันทึกไว้ก่อนหน้านี้ จากนั้นสร้าง tracer correlator สองตัว charge tracer คือการเปลี่ยนแปลงของความหนาแน่นต่อไซต์เทียบกับ :
spin tracer คือ connected correlator ระหว่างแต่ละไซต์กับไซต์ที่ว่าง :
ทั้งสองตัวสร้างจากตัวดำเนินการในฐาน Fock จึงมาจาก bitstring ที่วัดได้ชุดเดียวกัน และตัวที่สองไม่ต้องรันบนฮาร์ดแวร์เพิ่ม
ตอนที่สร้าง observable โค้ดได้บันทึกตำแหน่งของตัวดำเนินการ charge (charge_indices), spin (spin_indices) และ spin-correlation (correlator_indices) แต่ละตัวไว้ในลิสต์ เนื่องจากซิมูเลเตอร์คืนค่า expectation value ในลำดับเดียวกัน คุณจึงใช้ตำแหน่งเหล่านี้ดึงผลลัพธ์ที่ตรงกันออกมาได้ สำหรับ spin correlation โค้ดยังใช้ correlator_sites เพื่อวางผลลัพธ์แต่ละตัวลงในตำแหน่งแลตทิซที่ถูกต้อง และปล่อยตำแหน่งที่ว่างเป็น NaN
expectation_values = np.asarray(
    result["observable_expectation_values"], dtype=float
)
times = np.arange(expectation_values.shape[1]) * time_step

charge_density = expectation_values[charge_indices]
local_spin = expectation_values[spin_indices]
spin_correlator = np.full_like(charge_density, np.nan)
spin_correlator[correlator_sites] = expectation_values[correlator_indices]

# Charge tracer: change in per-site density relative to t = 0.
charge_tracer = charge_density - charge_density[:, [0]]

# Spin tracer: connected correlator with the vacancy site.
spin_tracer = 4.0 * (spin_correlator - local_spin * local_spin[vacancy_site])
spin_tracer[vacancy_site] = np.nan

print(
    f"{expectation_values.shape[0]} observables, "
    f"{expectation_values.shape[1]} time points up to t = {times[-1]:.2f}"
)
print(
    f"Peak amplitudes: charge {np.nanmax(np.abs(charge_tracer)):.3f}, "
    f"spin {np.nanmax(np.abs(spin_tracer)):.3f}"
)
92 observables, 31 time points up to t = 4.50
Peak amplitudes: charge 0.978, spin 0.168
แสดงภาพ wavefront
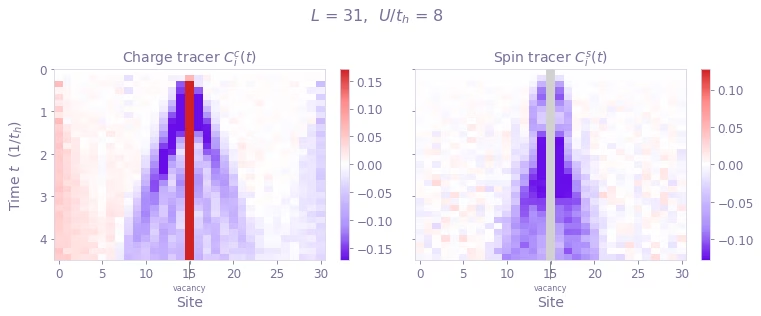
ถ้าพล็อต correlator แต่ละตัวเป็น heatmap ของปริภูมิและเวลา จะเห็น light cone ได้โดยตรง เวลาไหลลงด้านล่าง และแกนนอนคือตำแหน่งตามแนวโซ่
def plot_tracer(axis, tracer, title):
    """Draw one tracer correlator as a space-time heatmap, time flowing down."""
    # Scale from the off-centre sites. The vacancy site carries an order-one
    # change in charge density and is left to clip rather than set the scale.
    off_center = np.ones(site_count, dtype=bool)
    off_center[vacancy_site] = False
    limit = np.nanpercentile(np.abs(tracer[off_center]), 98)

    colormap = qv.QCTRL_DIVERGENT_COLORMAP.reversed().copy()
    colormap.set_bad("0.82")  # the spin tracer has no value at the vacancy

    image = axis.imshow(
        tracer.T,
        aspect="auto",
        origin="upper",
        cmap=colormap,
        vmin=-limit,
        vmax=limit,
        extent=(-0.5, site_count - 0.5, times[-1], times[0]),
        interpolation="nearest",
    )

    axis.annotate(
        "vacancy",
        xy=(vacancy_site, times[-1]),
        xytext=(vacancy_site, times[-1] + 0.55),
        ha="center",
        va="top",
        fontsize=8,
        annotation_clip=False,
        arrowprops=dict(arrowstyle="-", lw=0.8, color="0.4"),
    )

    axis.set_title(title)
    axis.set_xlabel("Site")
    return image

fig, axes = plt.subplots(1, 2, figsize=(11, 4.5), sharey=True)

charge_image = plot_tracer(
    axes[0], charge_tracer, r"Charge tracer $C^{c}_{i}(t)$"
)
spin_image = plot_tracer(axes[1], spin_tracer, r"Spin tracer $C^{s}_{i}(t)$")

axes[0].set_ylabel(r"Time $t$  $(1/t_h)$")
fig.colorbar(charge_image, ax=axes[0], fraction=0.046)
fig.colorbar(spin_image, ax=axes[1], fraction=0.046)
fig.suptitle(f"$L$ = {site_count},  $U/t_h$ = {on_site_interaction:.0f}")
fig.tight_layout()
plt.show()
ดึงความเร็วของ wavefront
แปลง heatmap เป็นตัวเลขโดยทำตามโปรโตคอลการตรวจจับจากงานวิจัยที่ตีพิมพ์ [2] ที่แต่ละช่วงเวลา ให้ทำให้โปรไฟล์เชิงพื้นที่สมมาตรรอบตำแหน่งที่ว่าง ซึ่งจะเฉลี่ยส่วนที่ไม่สมมาตรของสัญญาณรบกวนจากฮาร์ดแวร์ให้หายไป จากนั้น normalize ด้วยแอมพลิจูดนอกศูนย์กลางที่ใหญ่ที่สุด และบันทึกไซต์นอกสุดที่อยู่เหนือค่าขีดแบ่ง จากนั้นแบ่งการตรวจจับเป็นช่วงของ time step ที่ต่อเนื่องกัน และ fit เฉพาะช่วงที่ยาวที่สุด ซึ่งช่วยกันไม่ให้ transient ช่วงต้นปนเข้าไปในผลลัพธ์
def front_distance(profile, center, threshold):
    """Distance from `center` to the outermost site above a relative threshold."""
    values = np.nan_to_num(np.asarray(profile, dtype=float))
    length = values.size

    symmetrized = values.copy()
    for site in range(length):
        mirror = 2 * center - site
        if 0 <= mirror < length:
            symmetrized[site] = 0.5 * (values[site] + values[mirror])

    amplitude = np.abs(symmetrized)
    off_center = np.ones(length, dtype=bool)
    off_center[center] = False

    peak = amplitude[off_center].max()
    if peak <= 0.0:
        return np.nan
    above = np.flatnonzero((amplitude / peak > threshold) & off_center)
    return float(np.abs(above - center).max()) if above.size else np.nan

def longest_run(mask):
    """Indices of the longest run of consecutive True values."""
    best, current = [], []
    for index, keep in enumerate(mask):
        current = current + [index] if keep else []
        if len(current) > len(best):
            best = current
    return np.array(best, dtype=int)

def front_velocity(tracer, center, threshold=0.3, quantile=0.75, min_block=5):
    """Fit front position against time, using only the longest contiguous run."""
    distances = np.array(
        [
            front_distance(tracer[:, k], center, threshold)
            for k in range(tracer.shape[1])
        ]
    )
    edge = max(center, tracer.shape[0] - 1 - center)
    usable = (
        np.isfinite(distances) & (distances >= 2) & (distances <= edge - 2)
    )

    block = longest_run(usable)
    if block.size < min_block:
        return np.nan, distances, np.array([], dtype=int), np.nan

    candidates = [
        stats.theilslopes(distances[block[:k]], times[block[:k]]).slope
        for k in range(min_block, block.size + 1)
    ]
    cutoff = np.quantile(candidates, quantile)
    keep = max(i for i, value in enumerate(candidates) if value >= cutoff)

    fit_block = block[: keep + min_block]
    slope, intercept = np.polyfit(times[fit_block], distances[fit_block], 1)
    return float(slope), distances, fit_block, float(intercept)
ความเร็วที่ fit ได้ขึ้นกับค่าขีดแบ่งในการตรวจจับและ quantile ที่ใช้ตัดทอน และความไวนี้มีผลมากกว่า shot noise ให้สแกนทั้งสองค่าแล้วรายงานค่ามัธยฐานพร้อมช่วงครอบคลุมทั้งหมด เหมือนที่การวิเคราะห์ในงานวิจัยทำ
thresholds = [0.15, 0.225, 0.30, 0.375, 0.45]
quantiles = [0.60, 0.675, 0.75, 0.825, 0.90]

def velocity_envelope(tracer, center):
    """Median, minimum, and maximum velocity over the parameter scan."""
    values = [
        front_velocity(tracer, center, threshold=p, quantile=q)[0]
        for p in thresholds
        for q in quantiles
    ]
    values = np.array([v for v in values if np.isfinite(v)])
    if values.size == 0:
        return np.nan, np.nan, np.nan
    return float(np.median(values)), float(values.min()), float(values.max())

charge_velocity, charge_low, charge_high = velocity_envelope(
    charge_tracer, vacancy_site
)
spin_velocity, spin_low, spin_high = velocity_envelope(
    spin_tracer, vacancy_site
)

_, charge_front, charge_block, charge_intercept = front_velocity(
    charge_tracer, vacancy_site
)
_, spin_front, spin_block, spin_intercept = front_velocity(
    spin_tracer, vacancy_site
)

print(f"v_c = {charge_velocity:.2f}  [{charge_low:.2f}, {charge_high:.2f}]")
print(f"v_s = {spin_velocity:.2f}  [{spin_low:.2f}, {spin_high:.2f}]")
print(f"v_s / v_c = {spin_velocity / charge_velocity:.2f}")
v_c = 1.93  [1.81, 2.18]
v_s = 1.61  [1.23, 2.12]
v_s / v_c = 0.83
PUBLISHED = {"charge": 1.78, "spin": 1.46}

edge = max(vacancy_site, site_count - 1 - vacancy_site)
fig, axis = plt.subplots(figsize=(7, 4.6))

axis.axhspan(0, 2, color="0.92", zorder=0)
axis.axhspan(edge - 2, edge + 2, color="0.92", zorder=0)

series = [
    (
        "charge",
        "$v_c$",
        charge_front,
        charge_block,
        charge_velocity,
        charge_intercept,
        charge_low,
        charge_high,
        "C0",
        "o",
    ),
    (
        "spin",
        "$v_s$",
        spin_front,
        spin_block,
        spin_velocity,
        spin_intercept,
        spin_low,
        spin_high,
        "C1",
        "s",
    ),
]

for name, sym, front, block, v, b, lo, hi, color, marker in series:
    excluded = np.setdiff1d(np.arange(front.size), block)
    axis.plot(
        times[excluded],
        front[excluded],
        marker,
        color=color,
        markersize=5,
        markerfacecolor="none",
        alpha=0.45,
        zorder=2,
    )
    axis.plot(
        times[block],
        front[block],
        marker,
        color=color,
        markersize=5,
        label=f"{name}, {sym} = {v:.2f} [{lo:.2f}, {hi:.2f}]",
        zorder=3,
    )

    span = times[block]
    anchor = v * span[0] + b
    axis.plot(
        span,
        v * (span - span[0]) + anchor,
        "-",
        color=color,
        lw=1.6,
        zorder=4,
    )
    axis.fill_between(
        span,
        lo * (span - span[0]) + anchor,
        hi * (span - span[0]) + anchor,
        color=color,
        alpha=0.15,
        zorder=1,
    )
    axis.plot(
        span,
        PUBLISHED[name] * (span - span[0]) + anchor,
        "--",
        color=color,
        lw=1.2,
        alpha=0.8,
        zorder=4,
    )

axis.plot([], [], "--", color="0.4", lw=1.2, label="published [2]")
axis.plot(
    [],
    [],
    "o",
    color="0.5",
    markerfacecolor="none",
    label="excluded from fit",
)

axis.set_xlabel(r"Time $t$  $(1/t_h)$")
axis.set_ylabel("Front distance from vacancy (sites)")
axis.set_xlim(0, times[-1])
axis.set_ylim(
    0, min(edge + 1, np.nanmax(np.r_[charge_front, spin_front]) + 3)
)
axis.legend(loc="upper left", frameon=False, fontsize=9)
axis.set_title(
    f"L = {site_count}, $U/t_h$ = {on_site_interaction:.0f}, front propagation",
    fontsize=11,
)

fig.tight_layout()
plt.show()

การวาดจุดที่ตรวจจับได้กลับลงบน heatmap ช่วยให้เห็นว่าอัลกอริทึมตามขอบนำหน้าได้หรือไม่ เครื่องหมายทึบคือจุดที่ตรวจจับได้และถูกนำไป fit ส่วนเครื่องหมายโปร่งคือจุดที่ถูกตัดออกด้วยกฎการมาสก์ เพราะอยู่ใกล้ ตำแหน่งที่ว่างเกินไป ใกล้ปลายโซ่เกินไป หรือช้าเกินไปจนแนวหน้า ขยายกว้างและตำแหน่งไม่คมชัดอีกแล้ว เส้นประคือเส้น fit บน ช่วงเวลาที่ใช้ และความชันของมันคือความเร็วที่แสดงในชื่อของแต่ละแผง
คอลัมน์ของตำแหน่งที่ว่างถูกทำเครื่องหมายไว้ใต้แกน ค่า charge ถูกตัดที่ตรงนั้นเพราะค่าของมัน อยู่ในระดับหนึ่ง ส่วน spin ไม่มีค่าที่ตรงนั้น จึงวาดเป็นสีเทา
กรวย charge เปิดกว้างกว่ากรวย spin การรบกวนทั้งสองชนิดทิ้งตำหนิเดียวกัน ในจังหวะเดียวกัน และแผ่ออกไปด้วยความเร็วต่างกัน
def plot_tracer_front(axis, tracer, front, block, velocity, intercept, title):
    """Overlay the detected wavefront and the fitted cone on a tracer heatmap."""
    image = plot_tracer(axis, tracer, title)

    excluded = np.setdiff1d(np.arange(front.size), block)
    for index, filled in ((block, True), (excluded, False)):
        good = index[np.isfinite(front[index])]
        if good.size == 0:
            continue
        for sign in (-1, 1):
            axis.plot(
                vacancy_site + sign * front[good],
                times[good],
                "o",
                markersize=4,
                color="k",
                markerfacecolor="k" if filled else "none",
                markeredgewidth=0.9,
                alpha=1.0 if filled else 0.4,
            )

    span = times[block]
    for sign in (-1, 1):
        axis.plot(
            vacancy_site + sign * (velocity * span + intercept),
            span,
            "--",
            color="k",
            lw=1.5,
        )

    axis.set_title(f"{title}    $v$ = {velocity:.2f}")
    return image

fig, axes = plt.subplots(1, 2, figsize=(11, 4.5), sharey=True)

charge_image = plot_tracer_front(
    axes[0],
    charge_tracer,
    charge_front,
    charge_block,
    charge_velocity,
    charge_intercept,
    r"Charge tracer $C^{c}_{i}(t)$",
)
spin_image = plot_tracer_front(
    axes[1],
    spin_tracer,
    spin_front,
    spin_block,
    spin_velocity,
    spin_intercept,
    r"Spin tracer $C^{s}_{i}(t)$",
)

axes[0].set_ylabel(r"Time $t$  $(1/t_h)$")
fig.colorbar(charge_image, ax=axes[0], fraction=0.046)
fig.colorbar(spin_image, ax=axes[1], fraction=0.046)
fig.suptitle(f"$L$ = {site_count},  $U/t_h$ = {on_site_interaction:.0f}")
fig.tight_layout()
plt.show()
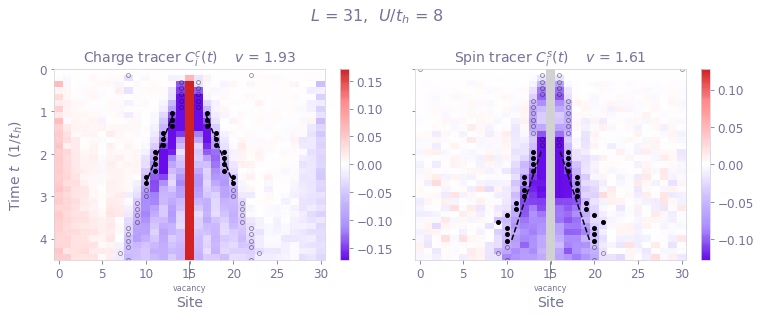
แนวหน้า charge วิ่งเร็วกว่าแนวหน้า spin โฮลในพื้นหลัง Mott หนึ่งมิติไม่ได้เคลื่อนที่เหมือนอิเล็กตรอน แต่จะแตกเป็น holon ที่พา charge กับ spinon ที่พาการรบกวนของ spin และที่ spinon เป็นตัวที่ช้ากว่า
ลำดับนี้ขึ้นกับอันตรกิริยา ที่ โมเดลเป็นเฟอร์มิออนอิสระที่มี และ ดังนั้น spin เร็วกว่า แรงผลักทำให้การขนส่ง spin ถูกกดลงโดยแทบไม่แตะการขนส่ง charge และเมื่อถึง ค่าจากฮาร์ดแวร์ที่ตีพิมพ์คือ และ [2] การรันซ้ำด้วยค่า หลายค่าแล้วพล็อต จะแสดงจุดตัดผ่านของลำดับนี้
ข้อควรระวังเกี่ยวกับตัวเลข การตรวจจับด้วยค่าขีดแบ่งมีความเอนเอียงต่ำลงเล็กน้อย จึงคาดได้ว่าความเร็ว charge จะต่ำกว่าค่าที่ตีพิมพ์ไม่กี่เปอร์เซ็นต์ ช่วงครอบคลุมของ spin กว้างเพราะ connected correlator อยู่ใกล้ noise floor มากกว่า นี่คือเหตุผลที่รายงานค่ามัธยฐานของการสแกนแทนการ fit ครั้งเดียว
เอกสารอ้างอิง
[1] Essler, F. H. L., Frahm, H., Gohmann, F., Klumper, A., & Korepin, V. E. (2005). The One-Dimensional Hubbard Model. Cambridge University Press.
[2] Hartnett, G. S., Najafi, K. S., Khindanov, A., Liao, H., Schutzman, M., Hush, M. R., Biercuk, M. J., & Baum, Y. (2026). Fast, accurate, high-resolution simulation of large-scale Fermi-Hubbard models on a digital quantum processor. arXiv:2605.04025.